I gotta run PageSpeed Insights against a couple thousand urls. The team wants to use core web vitals to start prioritizing improvements. On the data side, we want to see if we can correlate changes in core web vitals to changes in customer behavior.
The published rate limit for the API is 25k/day, 240 for every 4 minutes. That means it’s theoretically capable of 4 requests/per second.
I can’t get anywhere close to that.
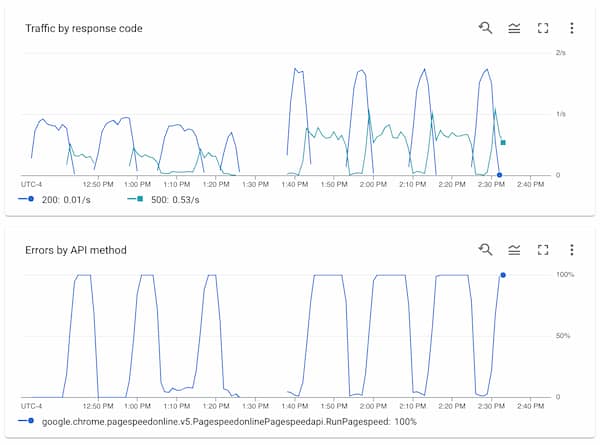
After my job runs for about 10m the API shits itself and starts returning 500: Unable to process request for about 5 minutes before recovering. This unanswered Stack Overflow question from Sept 2021 has details from another lost soul encountering this.
My graphs from the pagespeed api monitor show a timeseries of successful 200 responses at about 1 request/second for about, followed by a steep dropoff and a rise of 500s for about 5m before returning to all 200s.
I did another run about 10m later where I went from 30 to 60 workers, and that exhibits similar behavior. We are able to achieve higher throughput during the good times, but the good times last much shorter before the bad times.

This is consistent across dozens of runs at this point, and the error valleys happen between every 450-500 requests.
speculation
My theory is that this is some sort of per-origin limit. I tested this by spinning up another job using the same API key but targeting a different origin, and those requests worked totally fine while every worker in the original job was still busy 500ing.
I wonder if that per-origin limit is related to how expensive it is to do the pagespeed analysis? The main one I’m running against has fairly poor performance—it’s why I’m doing this to begin with.
Maybe the pagespeed api is all “I’m fuckin sick of waiting around for your garbage pages to load, gimme like 5 minutes, fuckkk” but if I were running against something that didn’t have 30s LCPs maybe it’d be happier?
mitigation
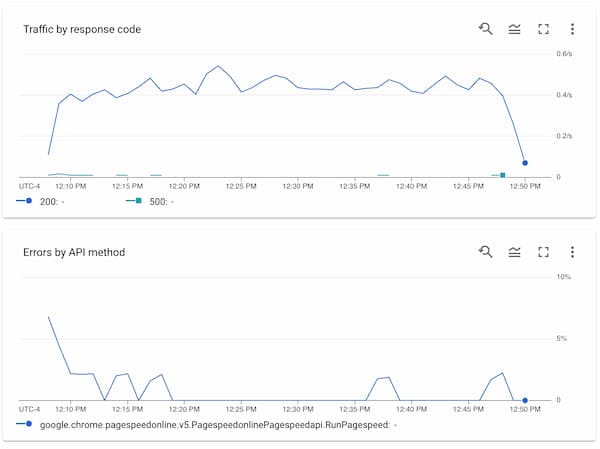
I have the job configured to run 16 workers and they are set to sleep between 1 and 180 seconds when they hit a 500. This seems to be the sweet spot for not getting caught up in too many 500s. They workers are currently set to retry forever, but I have a 4 hour timeout on the whole job so even if a worker gets caught in an infinite 500 loop, the job will eventually terminate.

I have a standard set of URLs I’m fetching pagespeed for, and that set is shuffled at the start of each run so even the job only ever finishes 95% of the urls, at least it’s a different 95% each time.
also the java client just sticks the API key in the url?
A real bummer when there’s an error that causes the internal Google HTTP library to dump the URL as part of the error message. Thanks for leaking my keys to the logs! Now I’m careful to wrap everything and scrub the key from all error output. I’ve also locked down the key so it’s only able to be used for the PageSpeed API.
listening to
HOLY FAWN - Dimensional Bleed